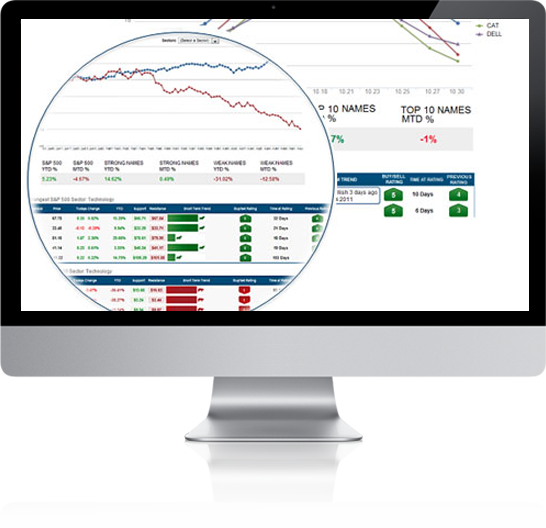
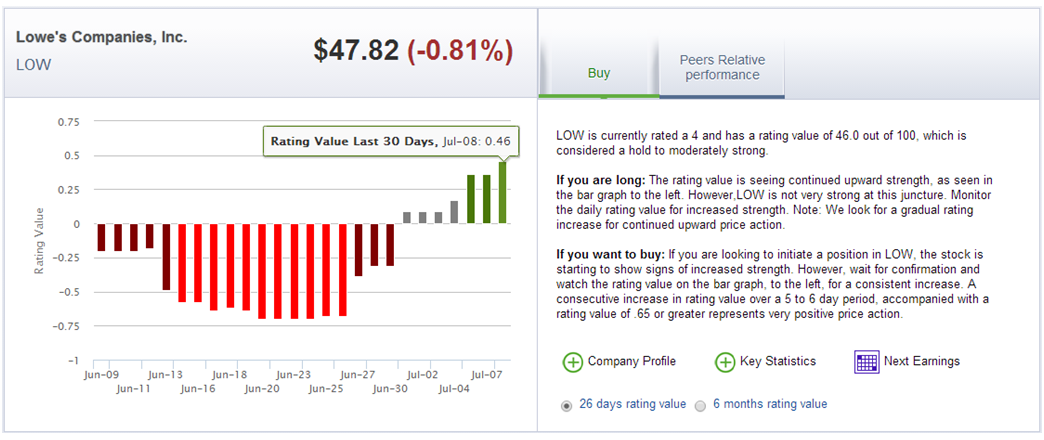
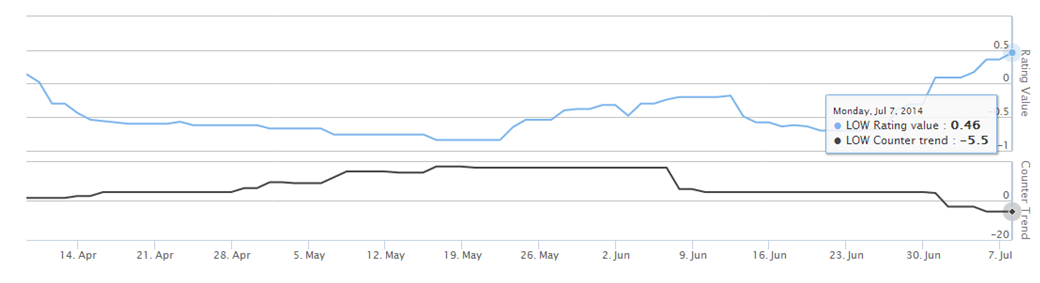
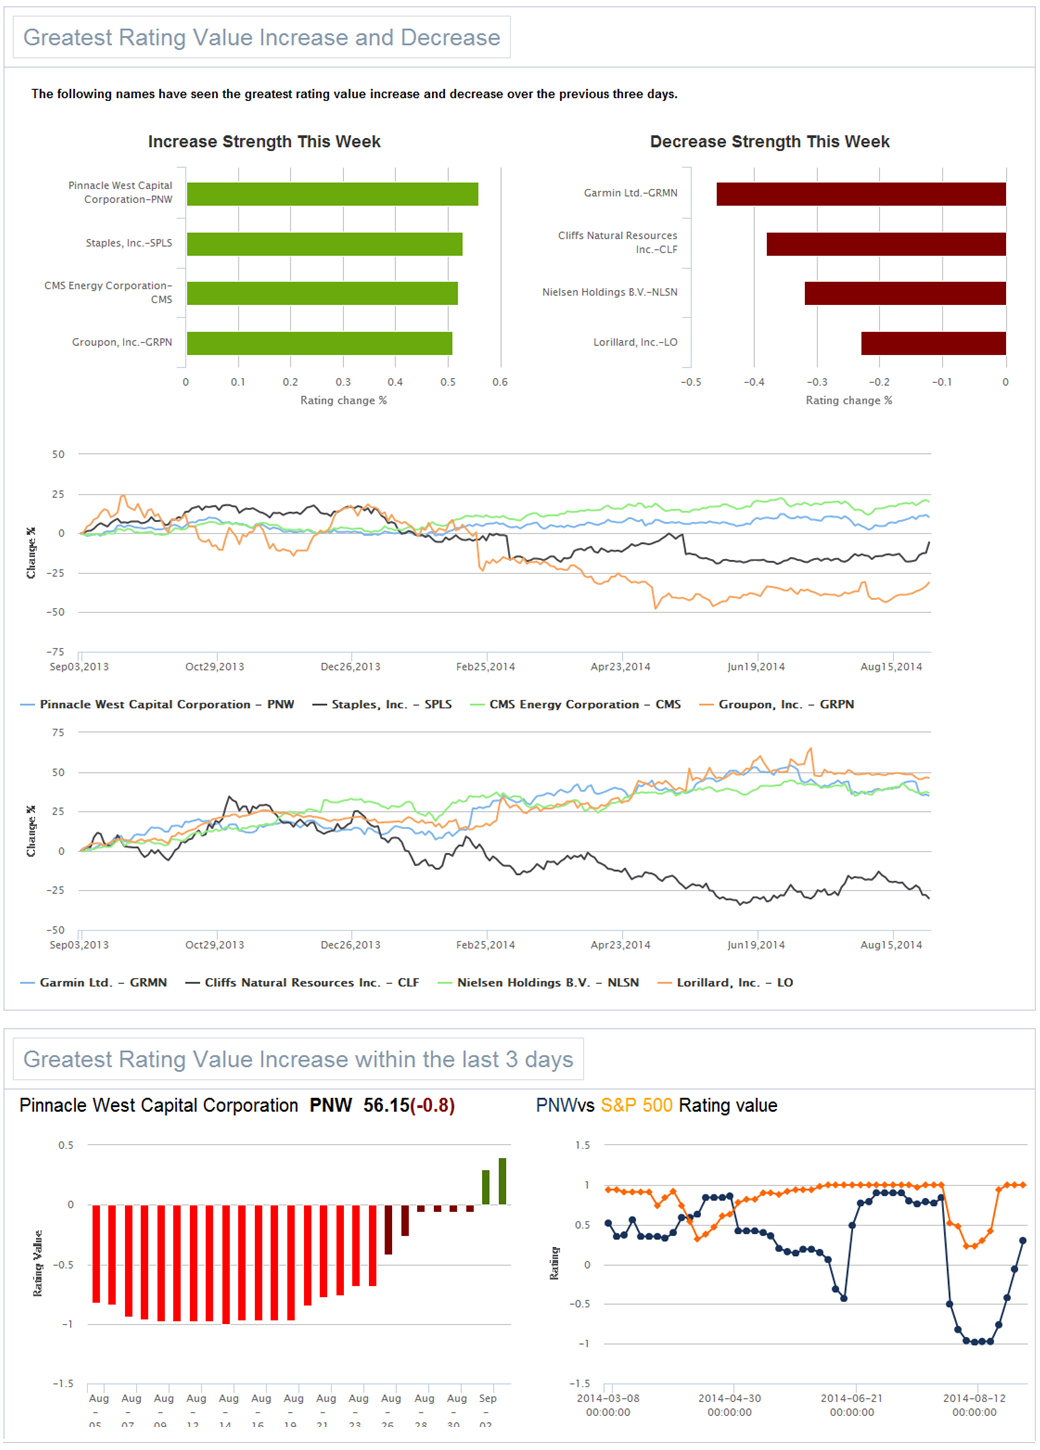
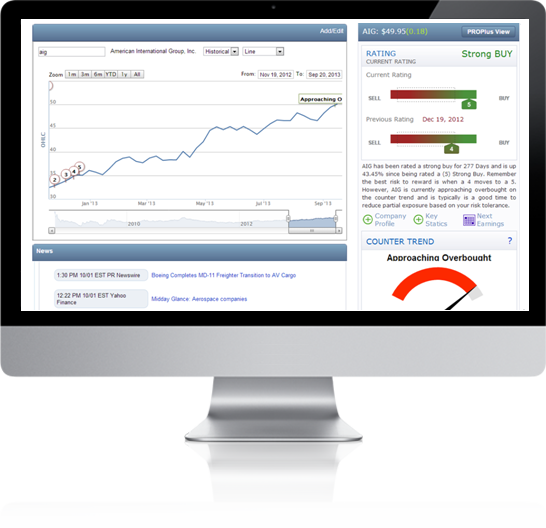
Greater Visibility and TransparencyProPlus provides everything you will find the basic platform with even greater visibility and transparency into our quantitative rating strength and counter trend matrices. See ChartlabPro's proprietary granular daily rating value for better position management |
Sign up to PROPlus for better portfolio management. Sign Up |
Greater scanning Ability
Greater Detailed Email alerts
Plus you will have access to the entire full platform features.
Basic platform
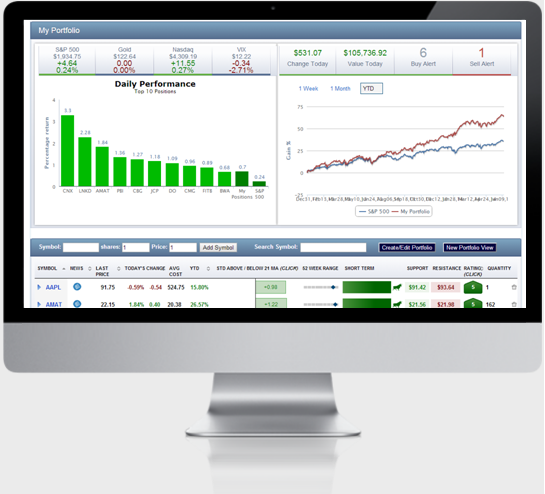
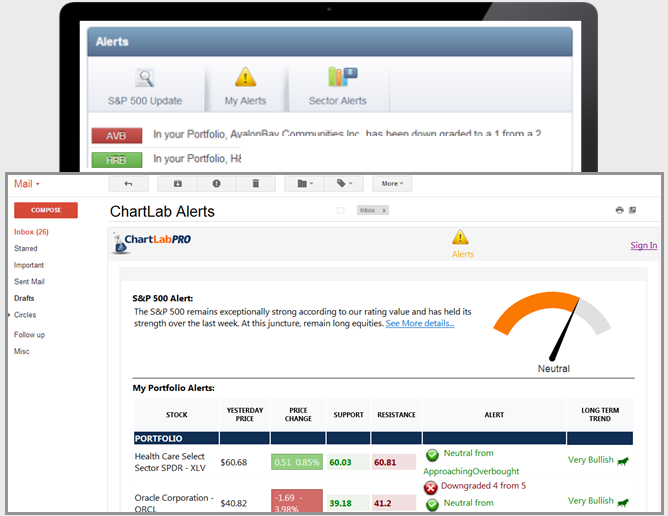
Dashboard
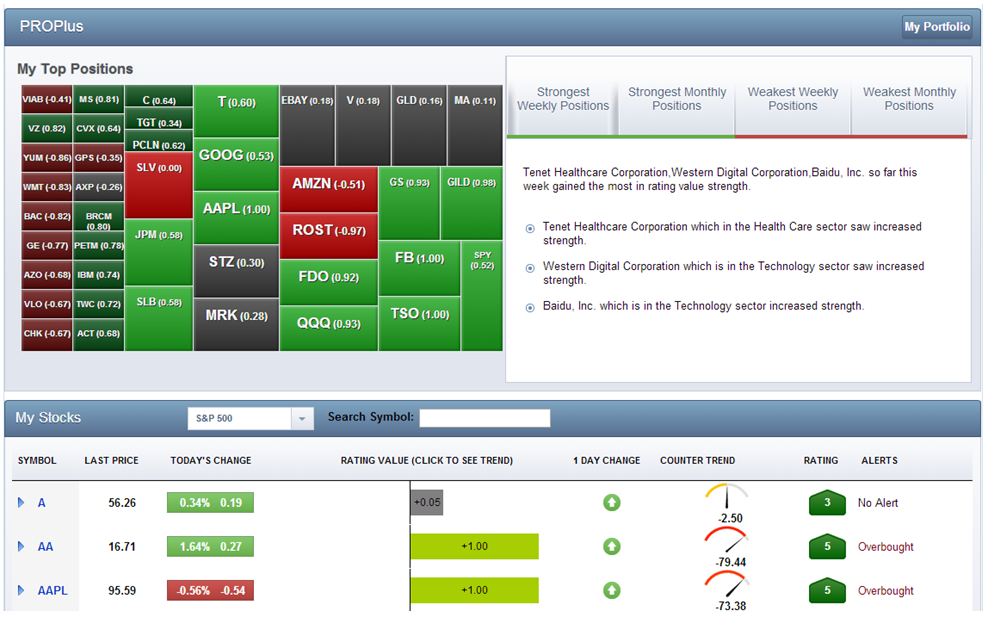
The dash board will give you updated alerts every day to take control of your portfolio. You will be alerted if your stock has a positive or negative rating change so you can make the appropriate modification to your portfolio.
- Find out if your stocks are buys or sells
- Find out if they are in a bullish or bearish trend (short, intermediate or long term)
- Proprietary Support and Resistance Levels
- Pattern Recognition alerts
- Company news, Company profile, Relative strength
- Monitor average cost, Position size, Long or short
Create Model Portfolios
Create multiple model portfolios based on your criteria for risk and return. Manage your portfolio's risk by seeing your model's beta, correlation, expected return and annualized volatility.
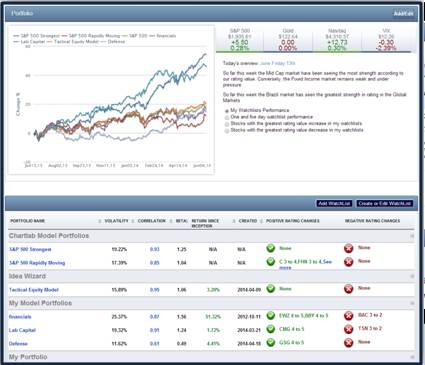
Sector Rotation
Our Sector Rotation page was designed to help discover changing patterns within S&P 500 sectors, so you can tactically allocate your assets.
Sign Up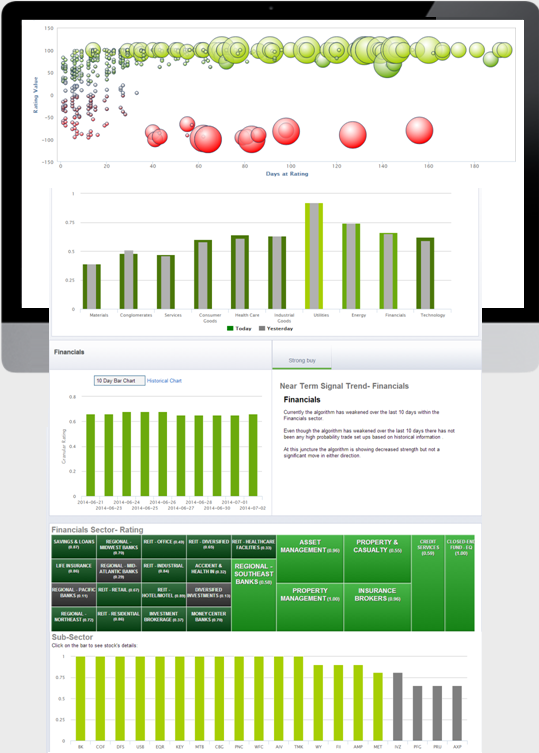
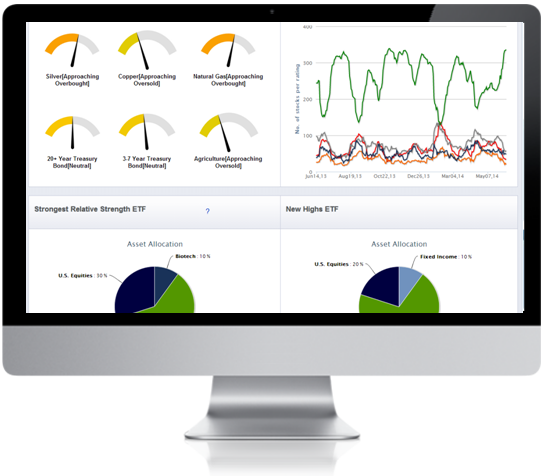
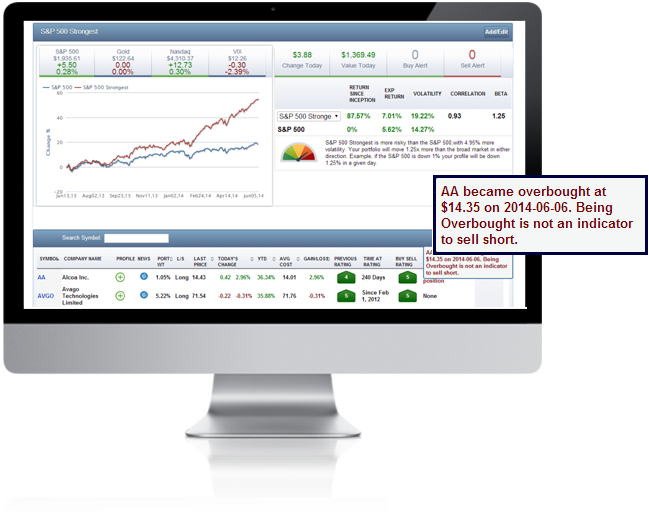
Market Internals
- S&P 500 Signals
- Historical S&P 500 Ratings
- Strongest ETF's
- S&P 500 Most Overbought and Oversold
- and much more...
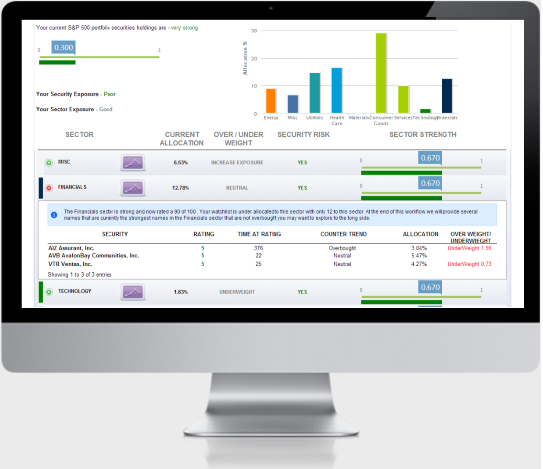
Portfolio Diagnostics
- Discover your current asset allocation vs. your target asset allocation
- Discover your sector exposure
- Discover your security exposure
- Discover your most risky positions and potential gain and loss
- Review historical back testing
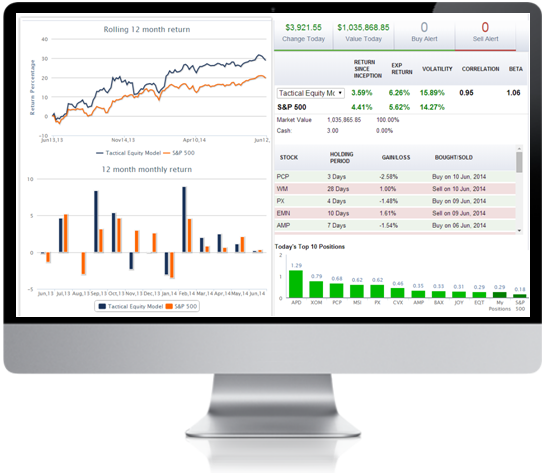
The Idea Wizard / Tactical Equity Model
The Idea Wizard helps establish a two step process to review the Tactical Equity Model. The Tactical Equity Model is a systematic quantitative program that formulates a view on expected short to intermediate term returns by analyzing the strongest S&P 500 stocks, on a momentum basis. The foundation for our research and strategy: Markets are not always efficient, and by allocating to the strongest 20 momentum stocks, within the S&P 500, we can create alpha while simultaneously minimizing downside volatility and risk.
The momentum based model will dynamically adjust for systematic risk, as high beta stocks become crowded, and reduce equity exposure. Additionally, the portfolio construction will dynamically change as risk premiums shift in the market, and rotate into more defensive sectors.
Learn more about the Tactical Model's back tested results.
Sources: Tactical Equity Model. The above models results are based on a model portfolio - please read full disclaimer.
Past Performance is not indicative of future results.
Buy Sell Rating Alerts
Receive email alerts on names you own or follow. Also receive alerts on sectors.
Alerts can be view on home page or email.
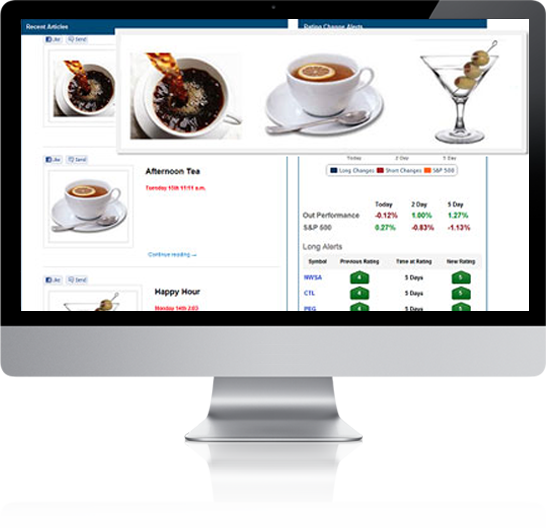
Morning Coffee, Afternoon Tea & Market Research
Chartlabpro.com offers market insight two times a day.
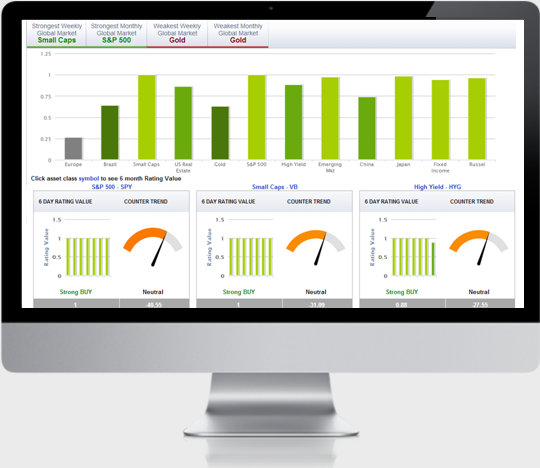
Sign UpGLOBAL ASSET CLASS
Discover Global Asset Class Trends for the following Markets:
- S&P 500
- U.S. Small Cap
- U.S. Mid Cap
- High Yield
- Fixed Income
- U.S. Real Estate
- China
- Japan
- Euzo Zone
- Emerging Markets
- Brazil
Automated Buy/Sell Ratings
Chartlabpro.com gives you rating changes from:
- Strong Buy (5 Rating)
- Buy (4 Rating)
- Hold (3 Rating)
- Sell (2 Rating)
- Strong Sell (1 Rating)
Rating Scan
Our proprietary algorithm scans the S&P 500 universe for the strongest names and tracks them for idea generation for your portfolio.
Our proprietary algorithm only measures S&P 500 stocks. We feel that S&P 500 universe provides the most liquid and efficient stocks.
Our scan allows you to view names for rapidly improving, contrarian and pair trades ideas.
We have been using this same algorithm for more than 15 years to run professional money