If you are using the same information as the crowd you have no edge. Learn how to apply our models for the following:
Buid a repeatable 5 minute trend following process.
Quickly Identify sector rotaion.
Quickly locate trend following buying opportunities.
Learn when to buy and sell based on our process.
Learn what technical to avoid for maximum trend following gains.
Bonus, enter your email for periodic special discounts.
How it works?
Our methodology is solely based on a quantitative approach. Through decades of gathering and testing empirical data; we believe pricing dynamics take precedent over fundamental analysis. Our proprietary algorithm is unique in that we do not use standard indicators that can be found in a typical charting package. It is our belief that using commonly followed tools such as Volume, MACD, RSI and certain Moving Averages provide little advantage to being profitable on a consistent basis.
The approach is simple; we apply a 1 to 5 buy / sell rating to the allocation of Stocks and ETF’s as a potential filter to upside price appreciation. Conversely, as prices of these underlying issues become extended, we use our counter trend indicators to reduce equity exposure.
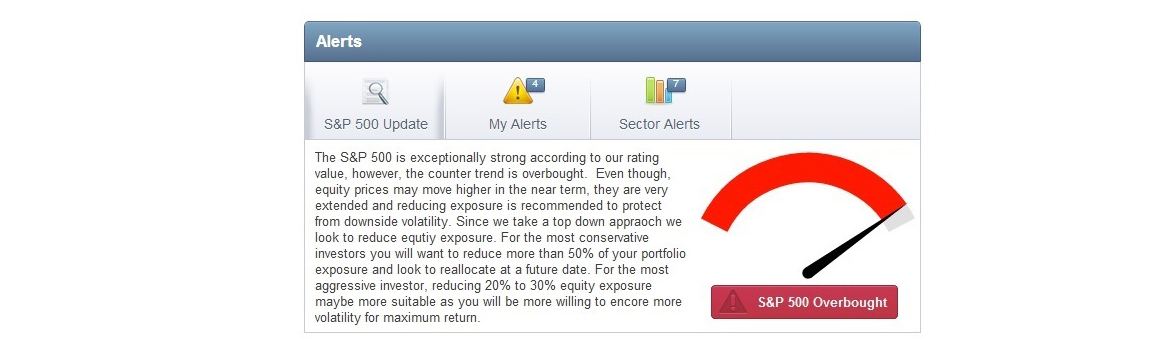
Our focus point is managing our downside risk while participating on the upside. In doing so, we start with a top down approach with the S&P 500. Members will be alerted on the home page of detailed analysis on the S&P 500 and specific action investors should take.
When the broad market is a buy we look to increase our equity exposure
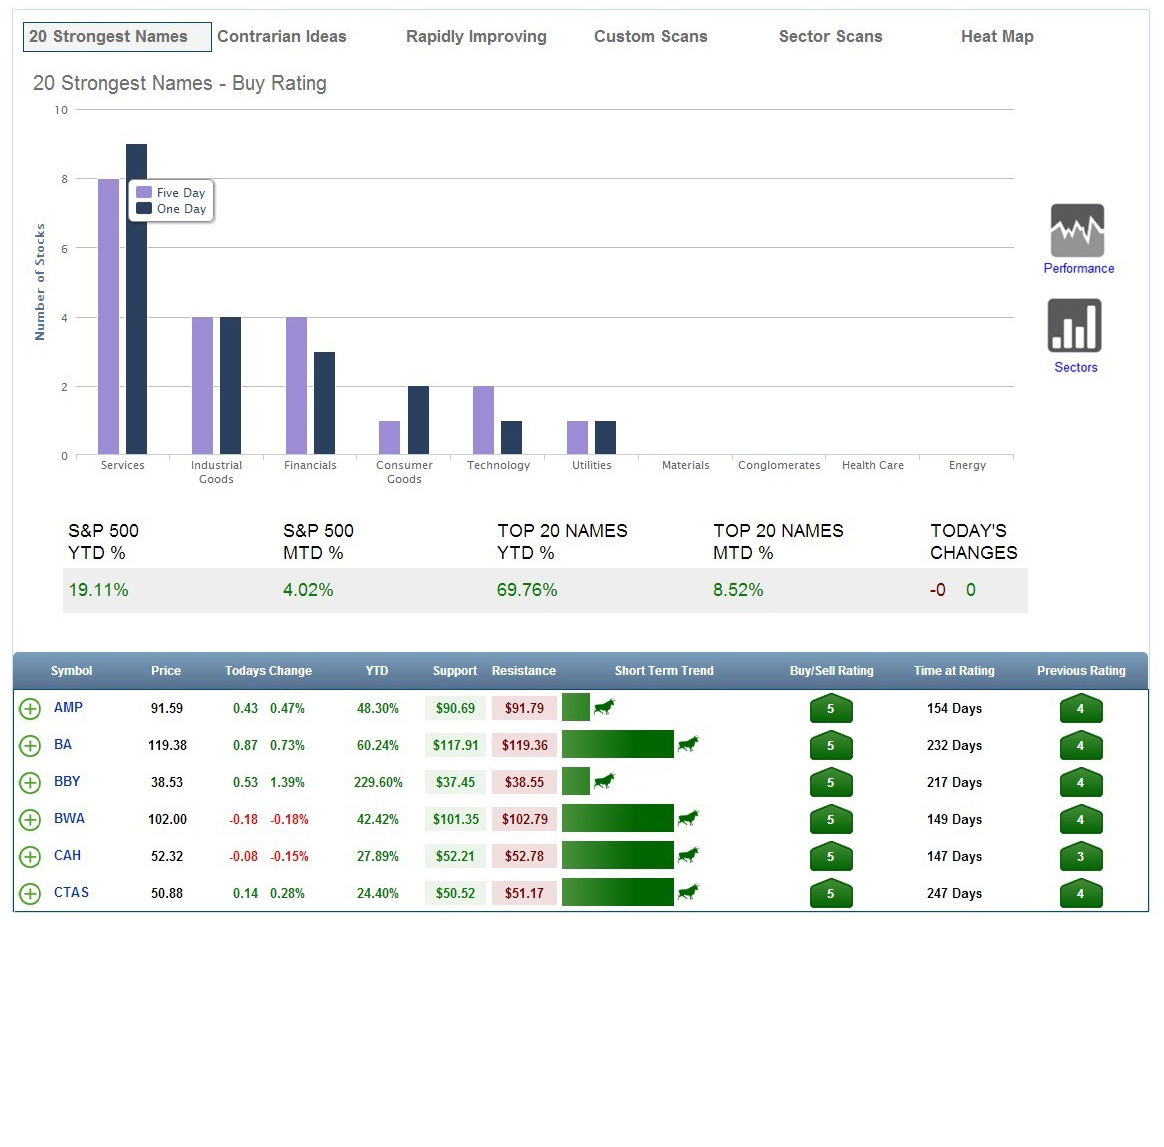
We provide a number of scans and idea generation to help select the right stocks and ETF's
that have a high probability of moving higher
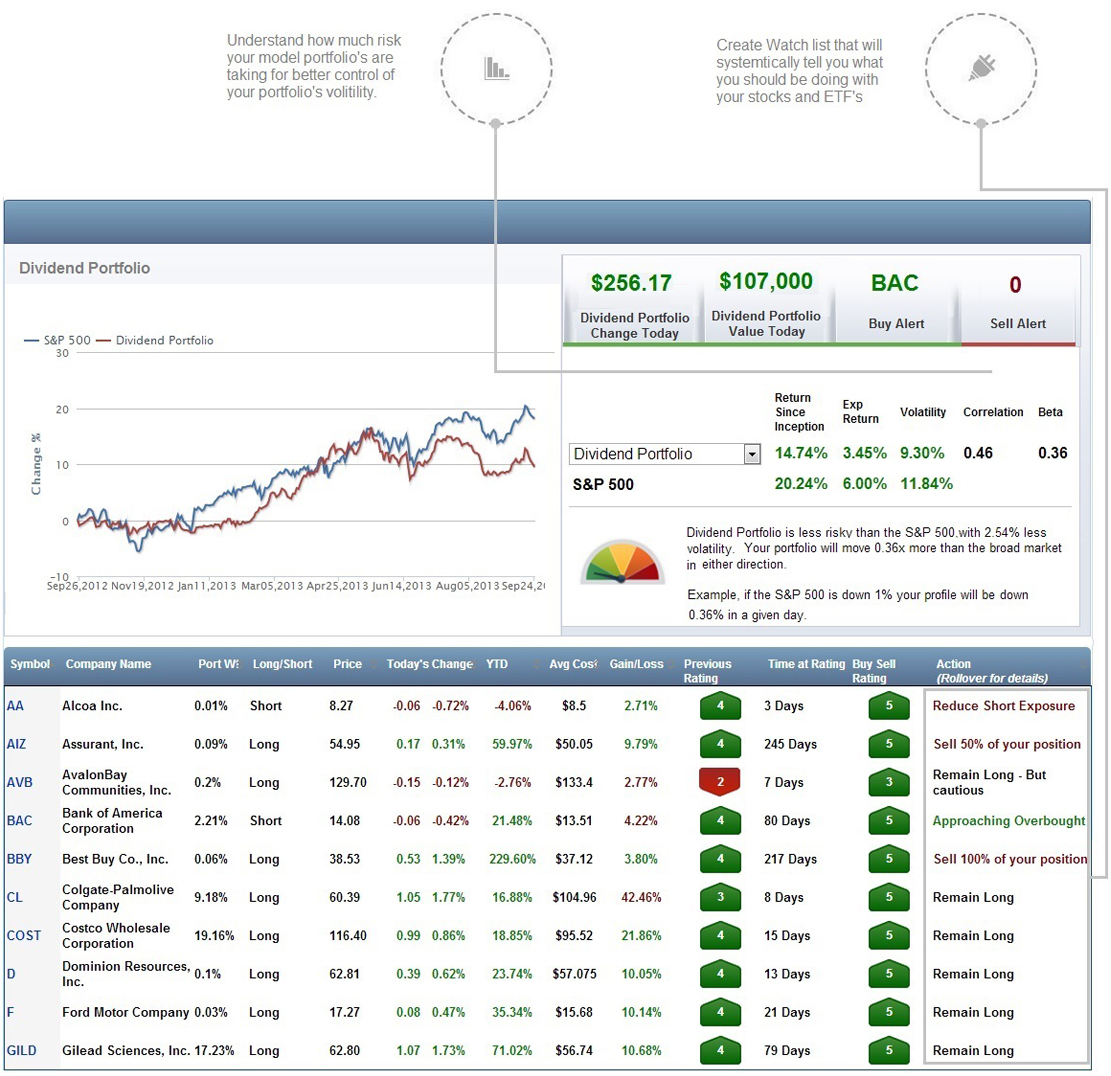
ChartLabPro.com monitors your watchlist and will let you know when it's time to buy
and sell both by email and visually through out the website.
TheChartLab.com and ChartLabPro.com is not a registered investment advisor or broker-dealer, and is not licensed nor qualified to provide investment advice. There is no requirement that any of our Information Providers be registered investment advisors or broker-dealers. Nothing published or made available by or through TheChartLab.com and ChartLabPro.com should be considered personalized investment advice, investment services or a solicitation to BUY, SELL, or HOLD any securities or other investments mentioned by TheChartLab.com and ChartLabPro.com or the Information Providers. Never invest based purely on our publication or information, which is provided on an "as is" basis without representations. Past performance is not indicative of future results. YOU SHOULD VERIFY ALL CLAIMS, DO YOUR OWN DUE DILIGENCE AND/OR SEEK YOUR OWN PROFESSIONAL ADVISOR AND CONSIDER THE INVESTMENT OBJECTIVES AND RISKS AND YOUR OWN NEEDS AND GOALS BEFORE INVESTING IN ANY SECURITIES MENTIONED. INVESTMENT DOES NOT GUARANTEE A POSITIVE RETURN AS STOCKS ARE SUBJECT TO MARKET RISKS, INCLUDING THE POTENTIAL LOSS OF PRINCIPAL. You further acknowledge that TheChartLab.com and ChartLabPro.com, the Information Providers or their respective affiliates, employers, employees, officers, members, managers and directors, may or may not hold positions in one or more of the securities in the Information and may trade at any time, without notification to you, based on the information they are providing and will not necessarily disclose this information to subscribers, nor the time the positions in the securities were acquired. You confirm that you have read and understand, and agree to, our full disclaimer and terms of use, a copy of which can be accessed by clicking here and that neither TheChartLab.com and ChartLabPro.com nor any of its Information Providers is in any way responsible for any investment losses you may incur under any circumstances.
 How it works?
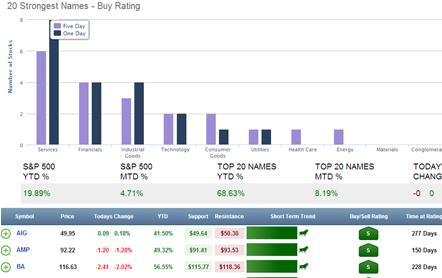 Our Approach